We don't provide Kedarnath helicopter booking or registration services. Please use official government portals only.
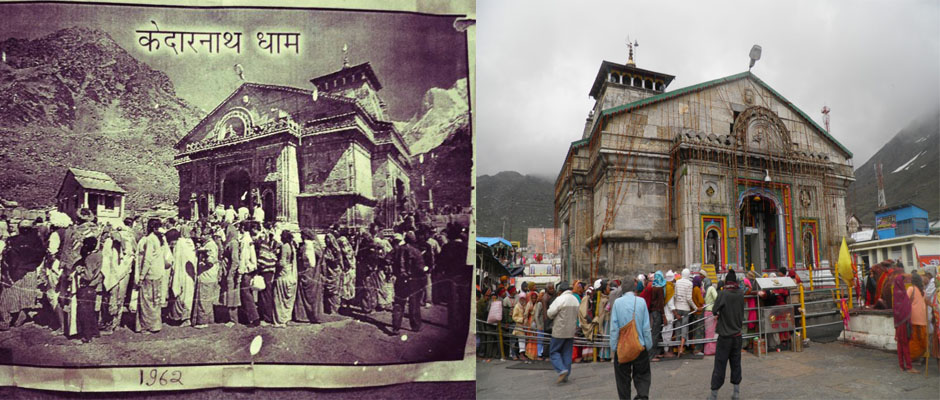
If you want to know how popular Kedarnath is? or how many pilgrims visit Kedarnath temple year, then you have come to the right place.
Pilgrimage and Tourist Stats for 2024 is given below in the table.


| Years | Shri Kedarnath Pilgrimage |
| 1990 | 117774 |
| 1991 | 118750 |
| 1992 | 141704 |
| 1993 | 118659 |
| 1994 | 104639 |
| 1995 | 105160 |
| 1996 | 105693 |
| 1997 | 60500 |
| 1998 | 82000 |
| 1999 | 80090 |
| 2000 | 215270 |
| 2001 | 119980 |
| 2002 | 169217 |
| 2003 | 280243 |
| 2004 | 274489 |
| 2005 | 390156 |
| 2006 | 485464 |
| 2007 | 557923 |
| 2008 | 470048 |
| 2009 | 403636 |
| 2010 | 400014 |
| 2011 | 570000 |
| 2012 | 548166 |
| 2013 | 312201 |
| 2014 | 40832 |
| 2015 | 154430 |
| 2016 | 309746 |
| 2017 | 4,71,235 |
| 2018 | 6,94,934 |
| 2019 | 10,00,821 |
| 2020 (Covid-19) | 1,35,000 |
| 2021 | 2,42,985 |
| 2022 | 4,25,075 |
| 2023 | 19,61,025 |
| 2024 | 16,52,070 |
Char Dham tour packages typically begin from popular starting points such as Delhi, Haridwar, Rishikesh, or Dehradun. Pilgrims need to reach one of these locations to start their sacred Char Dham Yatra. If you are traveling from another state in India, you must arrange your journey to the starting point on your own. Alternatively, you can request your chardham tour operator to organize transportation from your location to the starting point for a seamless travel experience.
By ensuring proper char dham travel arrangements in advance, you can avoid unnecessary hassles and focus entirely on your spiritual journey through the Char Dham circuit. Whether you choose to handle your travel or rely on your travel agent, planning ahead will make your char dham yatra stress-free and more fulfilling.


We would be glad if you can comment below and provide your valuable suggestions and feedback on Kedarnath Pilgrim Stats. If this Kedarnath Pilgrim Stats page have any wrong information/list or out of context content, then you can report us as well.
If you have any questions, you can also ask as in the following comments section. Our team will try to provide you answers/solutions.
We will analyze your requirements & find best Char Dham travel agents/operators whose expertise matches your travel request.
Get contacted by upto 3 selected Char Dham travel agents/operators. They will provide you the best Char Dham itinerary option according to your budget.
Choose best option among them & enjoy the trip. Give us your feedback
From where I can get this details.. I Want to see report on monthly basis for last 5 years